Source: TradingView.com
Key Takeaways
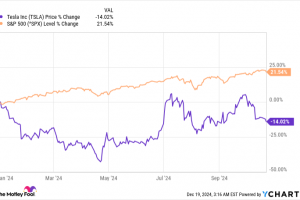
Shares in Berkshire Hathaway closed at a record high on Monday, buoyed by gains in some of the conglomerate’s key holdings.
The stock broke out from a symmetrical triangle, a chart pattern that suggests a continuation of the current uptrend.
The measuring principle projects a near-term price target in the shares of $465, while a bars pattern projects a longer-term target of around $500.
During retracements, Berkshire shares may find support around $415 from the symmetrical triangle’s top trendline, and near a multi-month uptrend line at $390.
Shares in Warren Buffett’s Berkshire Hathaway (BRK.A, BRK.B) closed at a record high on Monday, buoyed by gains in some of the conglomerate’s key holdings, including Apple (AAPL), American Express, (AXP), Chevron (CVX), and Occidental Petroleum (OXY). Investors typically view the performance of the company’s stock, which trades at about 23 times analysts’ full-year operating profit projections, as a proxy for the health of the U.S. economy due to its diversification across a broad range of industries.
Berkshire Hathaway shares added 2.4% to finish Monday’s session at $434.42.
Amid the stock’s move to record highs, we’ll take a closer look at the technicals on the Berkshire Hathaway weekly chart and identify important levels to watch out for.
Breakout From Symmetrical Triangle
Since bottoming out midway between the 50- and 200-week moving averages (MAs) in early October last year. Berkshire shares have trended consistently higher. More recently, the price broke out from textbook symmetrical triangle, a chart pattern that indicates a continuation of the current uptrend.
Importantly, the initial breakout from the pattern occurred on the highest weekly trading volume since late February, suggesting buying conviction behind the move. Moreover, the relative strength index (RSI) sits just below overbought levels to confirm strong price momentum in the stock.
Monitor These Price Levels Amid Further Upside
Below, we’ll use two different technical analysis techniques to predict near-term and…
..