Shares Gained More Than 6% on Monday
Source: TradingView.com
Key Takeaways
Intel shares climbed to a two-month high on Monday as analysts said the company stands to benefit from growing interest in AI personal computers and other hardware trends related to the technology.
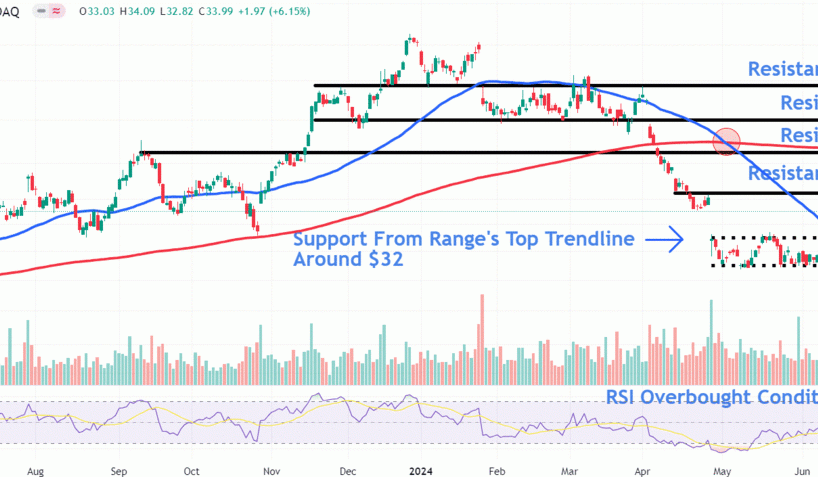
The Intel share price has gapped above the top trendline of a narrow trading range on the highest share turnover since June 21, indicating bullish conviction behind the move.
Amid further upside Intel shares may encounter resistance at $35.50, $39, $42. and $45.50.
Short-term overbought conditions could see the stock’s price retrace to the prior trading range’s top trendline around $32, which has now likely flipped from an area of resistance into support.
Intel (INTC) shares jumped more than 6% to a two-month high on Monday as analysts at Melius Research said the chipmaker stands to benefit from growing interest in artificial intelligence (AI) personal computers and other hardware trends related to the technology. The stock was the biggest gainer on the Nasdaq 100 and Dow Jones Industrial Average on Monday.
Below, we take a closer look at Intel’s chart and use technical analysis to point out key levels to watch out for in upcoming trading sessions.
Breakout From Narrow Trading Range
Despite the 50-day moving average (MA) crossing below the 200-day MA to form an ominous death cross in early May, Intel shares have traded within a narrow range with several volume spikes since that time.
On Monday, the chipmaker’s stock gapped above the trading range’s top trendline on the highest share turnover since June 21, indicating bullish conviction behind the breakout. Moreover, the relative strength index (RSI) has moved in overbought territory above the 70 thresholds, confirming strong price momentum.
Monitor These Chart Levels Amid Further Strength
Amid a continued move higher, investors should monitor these four key levels where the shares may encounter overhead resistance.
The first area to watch sits around $35.50, an area on the chart connecting prices near a minor countertrend retracement during the…
..


