The so-called Magnificent 7 stocks comprise the biggest US tech names, including Apple, Amazon, and Microsoft.Gabe Ginsberg/SOPA Images/LightRocket via Getty Images; Tony Avelar/AP
An “extremely bearish” pattern has formed on the Magnificent 7 stocks’ combined price chart, fueling fears of a selloff.
“For what’s worth, the top 7 largest tech stocks are currently staring down from a scary double-top technical formation,” Crescat Capital’s Octavio Costa wrote in a LinkedIn post.
That’s amplifying concerns that Wall Street’s reliance on a handful of Big Tech stocks may have reached unsustainable levels.
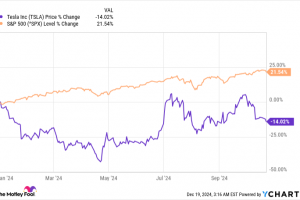
The US stock-market rally of 2023, which defied high interest rates and recession calls, has been led by a surprisingly small clutch of Big Tech names that have come to be known as the Magnificent 7.
The group — made up of Apple, Microsoft, Alphabet, Meta, Amazon, Nvidia, and Tesla — recently accounted for as much as 30% of the S&P 500 index’s entire market capitalization, fueling concerns that investment flows are getting over-concentrated in a narrow segment of the equity universe.
“Such an unprecedented concentration in a small cluster of stocks presents challenges as well as opportunities. The key challenge is that, due to the size of the Magnificent Seven, investors in the S&P 500 Index are now disproportionately exposed to the future prospects of these stocks,” Christopher Peel, portfolio manager and research analyst at Franklin Templeton, wrote in a recent note.
Such concerns are being amplified by an ominous chart pattern that’s now taking shape on a chart that tracks the combined price of the Magnificent 7 stocks. The signal, known as a “double top” in technical analysis, is widely considered as an omen for an imminent bearish trend reversal.
“A double top is an extremely bearish technical reversal pattern that forms after an asset reaches a high price two consecutive times with a moderate decline between the two highs. A double top signals a medium or long-term trend change in an asset class,” the online finance dictionary Investopedia defines the…
..